Licence
Copyright 2022 Wasja Bloch, Pascal Audet
Permission is hereby granted, free of charge, to any person obtaining a copy of this software and associated documentation files (the “Software”), to deal in the Software without restriction, including without limitation the rights to use, copy, modify, merge, publish, distribute, sublicense, and/or sell copies of the Software, and to permit persons to whom the Software is furnished to do so, subject to the following conditions:
The above copyright notice and this permission notice shall be included in all copies or substantial portions of the Software.
THE SOFTWARE IS PROVIDED “AS IS”, WITHOUT WARRANTY OF ANY KIND, EXPRESS OR IMPLIED, INCLUDING BUT NOT LIMITED TO THE WARRANTIES OF MERCHANTABILITY, FITNESS FOR A PARTICULAR PURPOSE AND NONINFRINGEMENT. IN NO EVENT SHALL THE AUTHORS OR COPYRIGHT HOLDERS BE LIABLE FOR ANY CLAIM, DAMAGES OR OTHER LIABILITY, WHETHER IN AN ACTION OF CONTRACT, TORT OR OTHERWISE, ARISING FROM, OUT OF OR IN CONNECTION WITH THE SOFTWARE OR THE USE OR OTHER DEALINGS IN THE SOFTWARE.
Installation
Dependencies
PyRaysum requires a modern Fortran compiler (e.g., gfortran, ifort) and obspy. By default, both numpy and matplotlib
are installed as dependencies of obspy.
Warning
There appears to be an issue when installing obspy==1.2.2 with numpy=1.22.2. If you run into AttributeError: ‘numpy.int64’ object has no attribute ‘split’, you can downgrade to numpy=1.21.5 with conda install numpy=1.21.5 within the conda environment (see below).
Conda environment
We recommend creating a custom
conda environment
where pyraysum can be installed along with its dependencies:
conda create -n prs python=3.8 fortran-compiler obspy -c conda-forge
Activate the newly created environment:
conda activate prs
You can interchange the name prs for any environment name you like.
Installing latest version from PyPI
pip install pyraysum
Installing development version from source
Clone the repository:
git clone https://github.com/paudetseis/PyRaysum.git
cd PyRaysum
Install using
pip:
pip install .
Testing
pyraysum is bundled with unit tests that can be run once the software is installed.
Install
pytest
conda install pytest
Run the tests
mkdir empty
cd empty
pytest -v ../pyraysum/tests/
Usage
Jupyter Notebooks
Included in this package is a set of Jupyter Notebooks (see Table of Content), that give examples on how to call the various routines and obtain plane wave seismograms and receiver functions. In particular, the Notebooks describe how to reproduce published examples of synthetic data from Porter et al. (2011).
After pyraysum is installed, these notebooks can be locally installed
(i.e., in a local folder Examples) from the package
by typing in a python window:
from pyraysum import doc
doc.install_doc(path='Examples')
This will also install packaged data that are necessary to run the notebooks.
Note that to run the notebooks, you will have to further install jupyter.
From the terminal, type:
conda install jupyter
Followed by:
cd Notebooks
jupyter notebook
You can then save the notebooks as python scripts,
check out the model files and set up your own examples.
Seismic velocity models
Loading a model file
In the Jupiter notebooks you will find a folder named data where a
few examples are provided. The header of the file model_Porter2011_dip.txt
looks like:
################################################
#
#   Model file to use with `telewavesim` for
#   modeling teleseismic body wave propagation
#   through stratified media.
#
#   Lines starting with '#' are ignored. Each
#   line corresponds to a unique layer. The
#   bottom layer is assumed to be a half-space
#   (Thickness is irrelevant).
#
#   Format:
#       Column  Contents
#          0    Thickness (m)
#          1    Density (kg/m^3)
#          2    Layer P-wave velocity (m/s)
#          3    Layer S-wave velocity (m/s)
#          4    Layer flag
#                   1: isotropic
#                   0: transverse isotropy
#          5    % Transverse anisotropy (if Layer flag is set to 0)
#                   0: isotropic
#                   +: fast symmetry axis
#                   -: slow symmetry axis
#          6    Trend of symmetry axis (degrees)
#          7    Plunge of symmetry axis (degrees)
#          8    Interface strike (degrees)
#          9    Interface dip (degrees)
#
################################################
This header is not required and can be deleted when you become familiar with the various definitions. Note that the code requires 10 entries per layer (i.e., per line), regardless of whether or not the variable is required (it will simply be ignored if it’s not).
Let us break down each line, depending on how you set Layer flag:
Layer flag set to 1
This case represents a case where the medium is isotropic.
Set column 0 (
Thickness), column 1 (Density), column 2 (P-wave velocity), column 3 (S-wave velocity) and column 4 (set to1)Set columns 5 to 7 to
0.or any other numerical value - they will be ignored by the code.Set columns 8 and 9 to the strike and dip angles of the top interface in degrees (0. by default)
Layer flag set to 0
This case represents a transversely isotropic medium. We adhere with the definition in Porter et al. (2011), whereby the parameter \(\eta\), which describes the curvature of the velocity “ellipsoid” between the \(V_P\)-fast and \(V_P\)-slow axes, varies with anisotropy for a 2-\(\psi\) model and is not fixed.
The column 5 in this case sets the percent anisotropy for both \(V_P\) and \(V_S\) (equal anisotropy for both \(V_P\) and \(V_S\)).
Set all columns to the required numerical value (and column 4 to
0)
Creating a Model class instance
Models can also be defined on the fly in Python using arrays or lists that contain
the relevant information as input into an instance of the
Model class.
Examples
>>> from pyraysum import Model
Define a model with two flat, isotropic layers (i.e., layer over half-space)
>>> thick = [20000., 0.]       # Second layer thickness is irrelevant (half-space)
>>> rho = [2800., 3300.]
>>> vp = [4600., 6000.]
>>> vs = [2600., 3600.]
>>> model = Model(thick, rho, vp, vs)
Define a model with transversely isotropic crust over isotropic half-space
>>> # Example using a single line
>>> model = Model(
     [20000., 0.],
     [2800., 3300.],
     [4000., 6000.],
     [2600., 3600.],
     [0, 1],
     [5., 0],
     [30., 0],
     [10., 0],
     [0., 0.],
     [0., 0.],
    )
Note
In this example all entries for the first layer are required. Here the
anisotropy is set to 5% (i.e., fast axis of symmetry; for slow axis the
user should input -5.) and the axis of symmetry has a trend of 30
degrees and a plunge of 10 degrees.
An important note on dipping layers
In the model setup, it is more appropriate to think of the layer strike and dip angles as the angles of the top interface. For a truly dipping layer, bounded above and below by dipping interfaces, the strike and dip angles should also be applied to the top interface of the underlying layer. Note that if those angles are not the same across the layers, dipping layer thickness is not conserved and the code may produce aberrant results. For instance, the dipping layer model of Porter et al. (2011) where a lower-crustal low-velocity layer has a strike of 90 degrees and dip angle of 20 degrees, is specified as:
>>> # Example of dipping layer from Porter et al. (2011)
>>> thick = [20000., 5000., 0.]
>>> rho = [2800., 2800., 2800.]
>>> vp = [6400., 5800., 7800.]
>>> vs = [3660., 3314., 4480.]
>>> strike = [0., 90., 90.]
>>> dip = [0., 20., 20.]
>>> model = Model(thick, rho, vp, vs, strike=strike, dip=dip)
Plotting a model
When a Model is created (or read from a file as above),
the model instance has methods to generate plots of the seismic velocity model
that it describes. The simplest option is to use the plot() method, which will
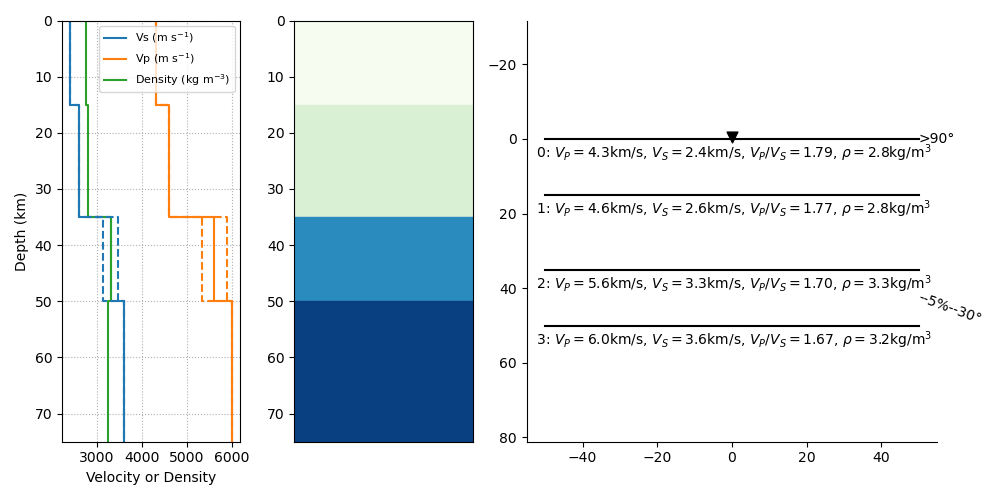
produce a figure with three subplots: 1) a stair-case plot of the seismic velocity
and density profiles, 2) a layered (stratigraphic-like) representation of the model,
and 3) a labeled geometric representation of layer properties. These subplots can
be created separately using the plot_profile(), plot_layers() and
plot_interfaces() methods directly.
Example
>>> from pyraysum import Model
Define a four-layer model with a mix of isotropic and transverse isotopic properties.
>>> thick = [15000., 20000., 15000.,  0.]
>>> rho = [2750.,  2800., 3300., 3250.]
>>> vp = [4300., 4600., 5600., 6000.]
>>> vs = [2400., 2600., 3300., 3600.]
>>> flag = [1, 1, 0, 1]
>>> ani = [0., 0., 5., 0.]
>>> trend = [0., 0., 30., 0.]
>>> plunge = [0., 0., 20., 0.]
>>> model = Model(thick, rho, vp, vs, flag=flag, ani=ani, trend=trend, plunge=plunge)

>>> model.plot()
Basic usage
These examples are extracted from the run() function.
The default type of the incoming teleseismic body wave is 'P' for compressional wave. Other options are 'SV' or 'SH' for vertically-polarized or horizontally-polarized shear wave, respectively. Incident wave types cannot be mixed.
Modeling a single event
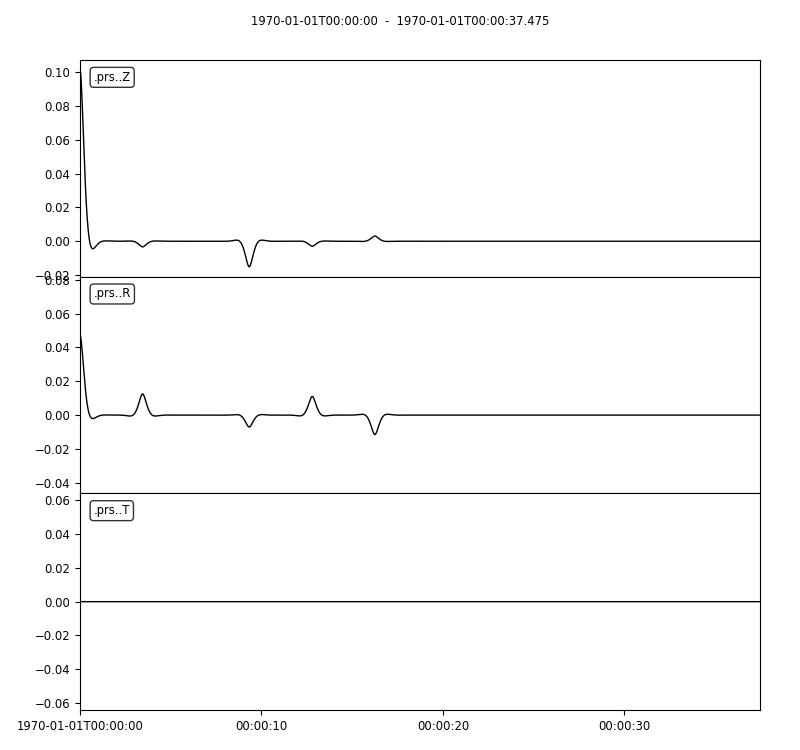
Here we model P waveforms from a single event, characterized by a back-azimuth of 30 degrees and slowness of 0.05 s/km. Let’s examine the synthetic waveforms that would be recorded in a Z-N-E coordinate system (rot=0) from the P-wave propagating through a simple homogeneous crust over a mantle half-space:
>>> from pyraysum import prs, Model, Geometry, Control
>>> # Define model with isotropic crust over isotropic half-space mantle
>>> model = Model([30000., 0], [2800., 3300.], [6000., 8000.], [3600., 4500.])
>>> # Define the ray geometry for one event
>>> geom = Geometry(30., 0.05) # baz = 30 deg; slow = 0.05 s/km
>>> # Define the run-control parameters
>>> # sampling of 0.025 s; 1500 samples; with multiples; in Z-N-E coordinate system
>>> rc = Control(dt=0.025, npts=1500, mults=1, rot=0)
>>> # Run Raysum for this setup
>>> streamlist = prs.run(model, geom, rc)
Examine the resulting three-component stream
>>> st = streamlist.streams[0]
>>> type(st)
<class 'obspy.core.stream.Stream'>
>>> print(st)
3 Trace(s) in Stream:
.prs..R | 1970-01-01T00:00:00.000000Z - 1970-01-01T00:00:37.475000Z | 40.0 Hz, 1500 samples
.prs..T | 1970-01-01T00:00:00.000000Z - 1970-01-01T00:00:37.475000Z | 40.0 Hz, 1500 samples
.prs..Z | 1970-01-01T00:00:00.000000Z - 1970-01-01T00:00:37.475000Z | 40.0 Hz, 1500 samples
Filter streams using a lowpass filter and plot using the obspy function.
>>> streamlist.filter('streams', 'lowpass', freq=1., corners=2, zerophase=True)
>>> streamlist.streams[0].plot()
Modeling multiple events
We again model P waveforms but this time for multiple event origins. The example above
can be slightly modified to use an array of back-azimuth values (and/or array of slowness
values). Let’s examine both options. Here we only modify the lines geom = and
keep the rest of the code snippet unchanged. We also modify the time limits in the plot
of amplitude versus slowness to emphasize the effect on delay times.
Array of back-azimuth values
>>> import numpy as np
>>> # baz from 0 to 360 deg; slow = 0.05 s/km
>>> geom = Geometry(np.arange(0., 360., 10.), 0.05)
>>> streamlist = prs.run(model, geom, rc)
>>> streamlist.filter('streams', 'lowpass', freq=1., corners=2, zerophase=True)
>>> prs.plot.stream_wiggles(streamlist)
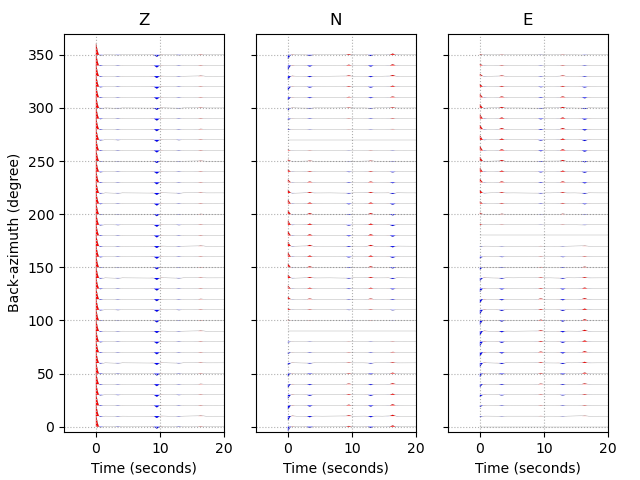
Note that the same figure could be obtained with:
>>> streamlist.plot('streams')
Array of slowness values
>>> # baz = 30 deg; slow from 0.04 to 0.08 s/km
>>> geom = Geometry(30., np.arange(0.04, 0.08, 0.002))
>>> streamlist = prs.run(model, geom, rc)
>>> streamlist.filter('streams', 'lowpass', freq=1., corners=2, zerophase=True)
>>> prs.plot.stream_wiggles(streamlist, btyp='slow', tmin=0., tmax=10.)
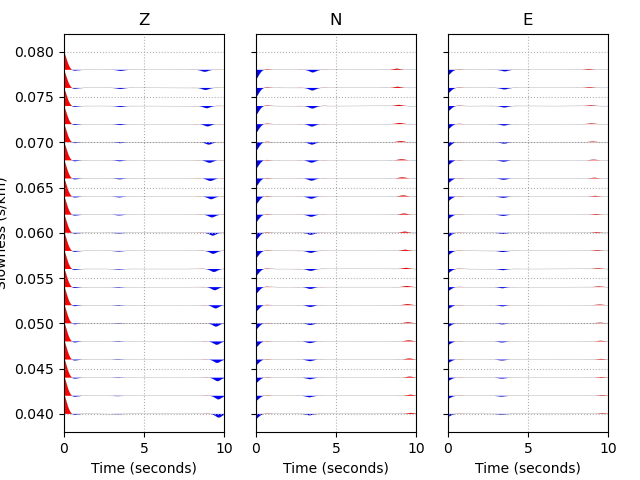
Note that the same figure could be obtained with:
>>> streamlist.plot('streams', btyp='slow', tmin=0., tmax=10.)
Modeling receiver functions
Receiver functions can only be calculated for component rotations equal to ‘1’ (R-T-Z system)
or ‘2’ (P-SV-SH system). There are two ways to calculate receiver functions - either directly
from the function run() with the argument rf=True (default is rf=False), or after
you have obtained the 3-component seismograms from run() with rot=1 or rot=2.
Here we calculate receiver functions for a single event. Other examples that describe receiver
function calculation for multiple events are included in the accompanying Jupyter notebook
tutorials.
Let’s first setup a simulation for a simple 2-layer model:
>>> from pyraysum import prs, Model, Geometry, Control
>>> # Define model with isotropic crust over isotropic half-space mantle
>>> model = Model([30000., 0], [2800., 3300.], [6000., 8000.], [3600., 4500.])
>>> geom = Geometry(0., 0.06) # baz = 0 deg; slow = 0.06 s/km
>>> rc = Control(dt=0.025, npts=1500, mults=1, rot=1)
Method 1
>>> streamlist1 = prs.run(model, geom, rc, rf=True)
>>> # Print stream of receiver functions
>>> print(streamlist1.rfs[0])
2 Trace(s) in Stream:
.prs..RFR | 1970-01-01T00:00:00.000000Z - 1970-01-01T00:00:37.475000Z | 40.0 Hz, 1500 samples
.prs..RFT | 1970-01-01T00:00:00.000000Z - 1970-01-01T00:00:37.475000Z | 40.0 Hz, 1500 samples
>>> # Filter and plot
>>> streamlist1.filter('rfs', 'lowpass', freq=1., corners=2, zerophase=True)
>>> streamlist1.rfs[0].plot()
Method 2
>>> streamlist2 = prs.run(model, geom, rc)
>>> streamlist2.calculate_rfs()
>>> # Print stream of receiver functions
>>> print(streamlist2.rfs[0])
2 Trace(s) in Stream:
.prs..RFR | 1970-01-01T00:00:00.000000Z - 1970-01-01T00:00:37.475000Z | 40.0 Hz, 1500 samples
.prs..RFT | 1970-01-01T00:00:00.000000Z - 1970-01-01T00:00:37.475000Z | 40.0 Hz, 1500 samples
>>> # Filter and plot
>>> streamlist2.filter('rfs', 'lowpass', freq=1., corners=2, zerophase=True)
>>> streamlist2.rfs[0].plot()
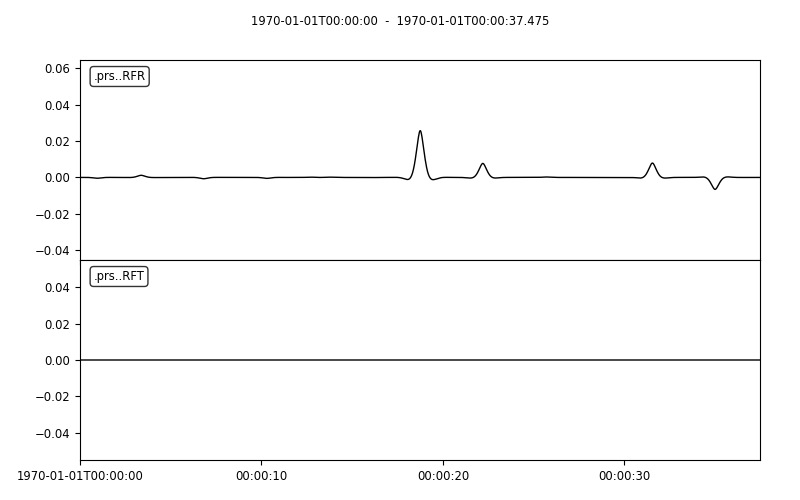
Both methods will produce the same receiver function figure. Notice the zero lag time is
located at the center of the time axis. You can also observe wrap-around effects (weak
arrivals before zero-lag time). Be careful when selecting time sampling parameters when
running Raysum to minimize those.
